前回の記事でdjango + celeryの環境を作ったので今回は `flower`というモジュールを使ってceleryで実行されるタスクのモニタリングをやってみたいと思います。
環境
django: 2.2.4
python: 3.6.9
celery: 4.3.0
requirements.txt
flowerというモジュールを使いますので、まずは requirements.txtに下記を追加します。
flowerdocker-compose.yml
flowerはブラウザでポート5555でアクセスするものなので、ポートを開いてあげます。前回から使っているdocker-compose.ymlの `django`の追記します。
django:
    restart: always
    build: .
    volumes:
      - ./:/opt/apps
    depends_on:
      - db
      - redis
    command: /bin/sh -c "cd /opt/apps; pip install -r requirements.txt; python manage.py migrate; python manage.py runserver 0:8000"
    ports:
      - 8000:8000
      - 5555:5555 ←ここを追加
これで準備はできました。では実行してみましょう。
flowerプロセスを起動
dockerコンテナ上で下記コマンドを実行します。
celery -A アプリケーション名 flower実行結果が下記のようになれば成功です。 `warning`が出ていますが、解決方法がわからなかったのでとりあえず放置です。flowerを使う分にはこのままで問題ありません。
 # [I 190929 03:18:50 command:136] Visit me at http://localhost:5555
[I 190929 03:18:51 command:141] Broker: redis://redis:6379/0
[I 190929 03:18:51 command:144] Registered tasks:
    ['app.tasks.say_hello',
     'celery.accumulate',
     'celery.backend_cleanup',
     'celery.chain',
     'celery.chord',
     'celery.chord_unlock',
     'celery.chunks',
     'celery.group',
     'celery.map',
     'celery.starmap',
     'tw_app.celery.debug_task']
[I 190929 03:18:51 mixins:229] Connected to redis://redis:6379/0
[W 190929 03:18:54 control:44] 'stats' inspect method failed
[W 190929 03:18:54 control:44] 'active_queues' inspect method failed
[W 190929 03:18:54 control:44] 'registered' inspect method failed
[W 190929 03:18:54 control:44] 'scheduled' inspect method failed
[W 190929 03:18:54 control:44] 'active' inspect method failed
[W 190929 03:18:54 control:44] 'reserved' inspect method failed
[W 190929 03:18:54 control:44] 'revoked' inspect method failed
[W 190929 03:18:54 control:44] 'conf' inspect method failed
Visit me at http://localhost:5555とありますので、visitしてみましょう。
ブラウザでアクセス
ブラウザで http://localhost:5555 を開いてみてください。↓の画像のようなページに遷移できたら成功です。

workerを立ち上げていないので今はここには何も表示されていませんね。では次にworkerを立ち上げてみましょう。
celeryでworkerを立ち上げる
前回と同様に下記のコマンドでworkerを立ち上げます。
$ celery -A tw_app worker -Q say_hello -c 2 -l info ブラウザに戻ってみると、workerが表示されています。

では次にタスクを実行してみましょう。
タスクを実行してみる
前回使ったコマンドでキューを溜めていきます。ただし、処理がプリントするだけなので瞬殺されてしまい、キューが溜まっている状況を見ることができません。ということで簡易的に処理に `sleep`を入れて重い処理を行っている状態を作ります。sleepは10秒入れます。
from celery.task import task
from django_redis import get_redis_connection
from time import sleep # ← 追記
@task
def say_hello():
    sleep(10)    # ← 追記
    print("start say_hello")
    print("hello")
    print("end say_hello")
この処理を下記のコマンドでどんどん実行してキューを溜めていきます。
for i in `seq 1000`
do
python manage.py set_say_hello_queue
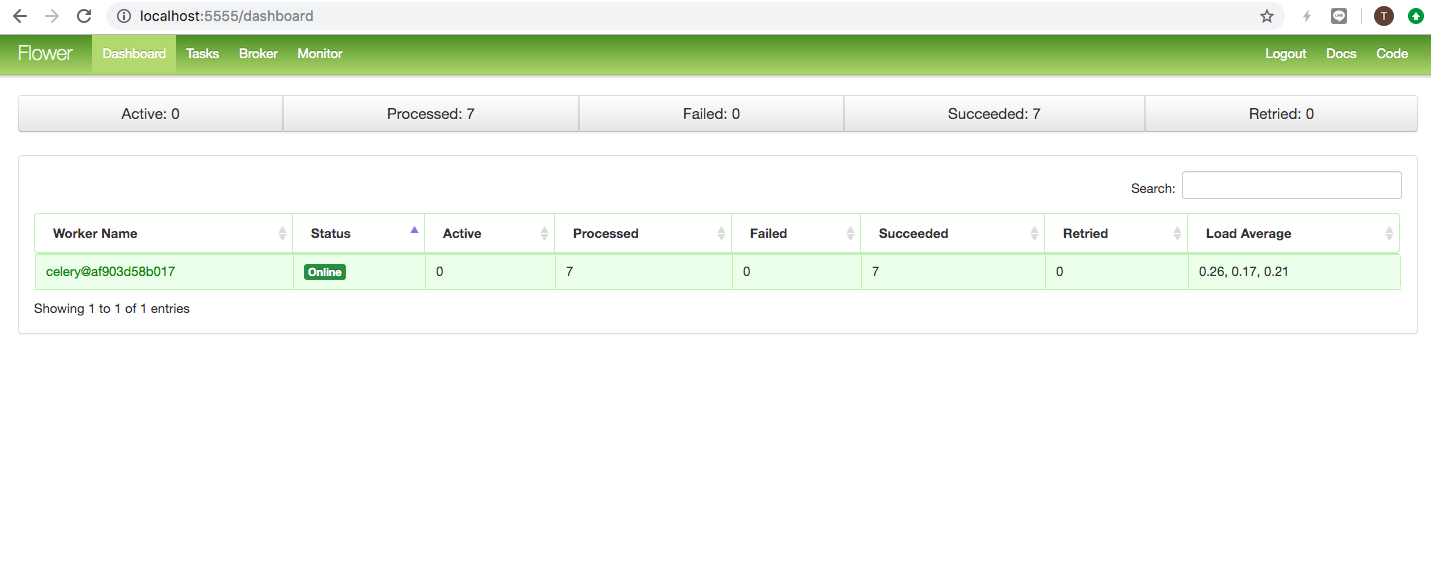
doneキューを積む処理はまだ終わってませんが、こんな感じになります。

これを見ると、flowerの各項目は以下のようになるということになります。
Active
これは今実行されている処理の数です。
(現在はconcurrencyは2)
Processed
これは実行された処理の数です。これがトリッキーで、完了した処理と まだ完了してないが混ざっています。ちょっとわかりにくいですね。。。個人的にはまだ処理が始まっていないキューの数を見れた方が嬉しいと感じました。あといくつキューが残っているなということがわかるので。
Failed
処理に失敗した処理数です。
Succeeded
処理に成功した処理数です。
まとめ
今回はceleryで行われる非同期処理のモニタリングモジュールのflowerを導入してみました。キューがどのくらいさばかれているかなどの可視化ができるので結構便利です。設定もそんなに難しくないので、celeryを導入してるアプリケーションにはぜひ入れるのをオススメします。
ただ、やはり個人的にはあとどれくらいのキューが待機状態にあるのかは知りたいのでそこは改善してほしいです。他にもモニタリングツールはあるみたいなのでそっちも試してみたいです。次は `django_celery_monitor`かな。
最後までお読みいただき